 In today’s game the definition of the ‘best’ player is changing. From a time when goals and assist were the determination of success, to the realm of utilizing statistics to evaluate a player’s contributions that lead to those goals and assists.
Understanding a player’s on-ice ability, whether you’re a scout, coach, or general manager, revolves around what that player contributes in actions that directly and indirectly lead to winning. Historically, this evaluation has been the ‘eye test’ coupled with points, plus/minus, and penalty minutes. Well, we’re proud to say due to the efforts of statisticians such as Garret Hohl and the likes, you don’t have to make quick decisions without significantly understanding how players compare amongst each other.
Through the natural evolution of hockey analytics we’ve gone from plus/minus, to corsi, to now THP.
What’s THP you ask? It’s The Hohl Picture…
The Definition of THP:
An advanced statistic that measure a player’s specific production differential while on the ice including saves, blocked shots, missed shots, hits, penalties taken, and face-offs. The Hohl Picture captures the differential of these actions in comparison to goal differential which determines winning. By categorizing a player’s production in each one of these actions, you’re able to statistically determine what they provide to your chance of winning. By specifically understanding what is comprised in a successful winning percentage, you’re able to clearly see which on-ice actions hold more influence and directly cause winning and losing. THP evaluation provides a significant context to evaluate team success and efficiency.
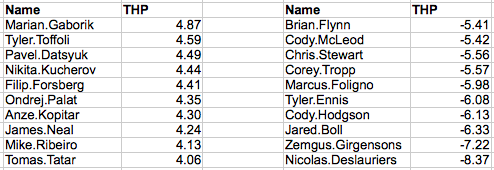 Utilizing data provided by the NHL below are the best and worst players of the 2014-15 season based on THP. While Marian Gaborik play on the ice correlated to the most in future goals-for vs goals-against, he finished 100th in points. Interestingly enough, Nikita Kucherov finished 1st in plus/minus (entire NHL). When you look at the specific contributions of each of these players, you start to see the value that THP is able to identify.
Conversely, when you look at Brian Flynn’s contributions he displays a plus/minus ranking of 652nd, while having a scoring percentage ranking of 456. Cody McLeod ranked 2nd in penalty minutes, while Nicolas Deslauriers ranked 862nd in plus/minus.
The key value of THP is it’s able to identify a context comparison in these players in a uniform number; rather than having to look at their individual plus/minus, scoring percentage, or penalty minutes, that support the THP findings.
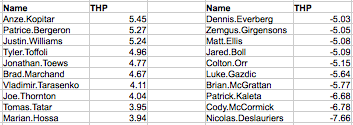
Here are the best and worst players based on THP from the last three NHL Seasons:
If you’re interested in learning more about THP, follow Garret Hohl on Twitter @GarretHohl or email us at contact@ckmsports.com
