Everyone knows the often misappropriated saying of “lies, damn lies, and statistics” with how an individual can manipulate numbers by ignoring what does not fit. Numbers are no different than stories: people can see what they want to see if they try hard enough. However, numbers and stories are necessary in understanding what happened and making more informed, and therefore potentially better, decisions.
The game of hockey is a goal scoring contest; the team with the most goals wins. It can be broken down to it’s individual events like shots, penalties, hits, passes, and hits to gain a better understanding of what is going on.From this we can better understand how events relate to the teams and players that best drive wins, like we do here at CKM with numbers like our own THP.
However, the information does not stop there at this level. We can also delve into the events to look into why particular players and teams produce the individual events as they do. There are two factors go into a player’s impact on the game: the decisions a player makes and their ability to successfully follow through. As the manager of JetsNation.ca, I have a particularly strong familiarity with the Winnipeg Jets for examples. This summer the Jets had two players enter free agency, Drew Stafford and Michael Frolik. Both players ended up signing multi-year contracts worth over four million a year. The two have been similarly effective in scoring. Over the past three seasons Frolik has scored 94 points in 208 games, and 1.68 points per 60 minutes. Stafford has scored 95 points in 192 games, and 1.71 points per 60 minutes.
 However, when Frolik has been on the ice his teams have controlled 54.3 per cent of shot attempts, which is 3.4 points more than when he is on the bench. Stafford’s teams have only controlled 43.0 per cent of shot attempts, and are worse by -0.7 points than when he is on the bench. Playing on the tanking Buffalo Sabres does not help Stafford’s numbers, but even as a Jet he did not perform as well as Frolik and only posted 50.2 per cent control of shot attempts, worse by -3.4 points than when on the bench.
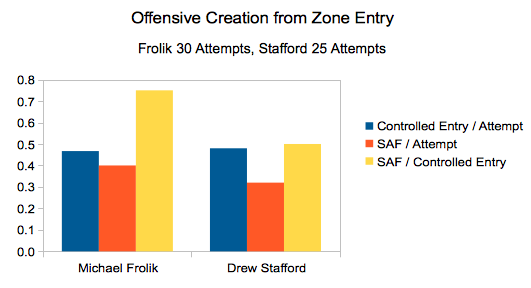
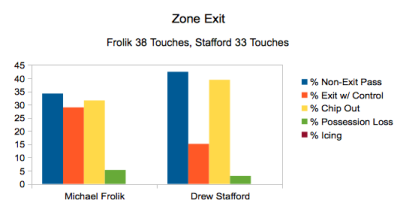
We can look deeper into the numbers with a player’s ability to make decisions and successfully follow through in order to see why that is. The following are just a few of the micro-statistics possible to look at player’s contributions to out shooting and scoring their opponents. The data all comes from a small five game season last year where the Jets dressed both Michael Frolik and Drew Stafford on different lines, and is for 5-on-5 even-strength situations only. First we can look at how each player does in breaking out the puck from the defensive zone.
 Both players had the puck on their stick between 30 to 40 times in the defensive zone. Both players also loss possession of the puck a similar percentage of the time. The difference was with their decision making. Stafford rarely got the puck out on his own with either a breakout pass or skating out the puck. He often deferred to his linemates or chipped out the puck. While a chip out is preferred over a possession loss, more-often-than-not the results are the same with the team in the defensive zone without the puck (over 50 per cent vesus less than 5 per cent for controlled exits). After all, a chip out play is simply a voluntary possession loss. Frolik chipped out the puck far less often and was able to successfully get the Jets out of the defensive zone with control of the puck. Then we can look at the other side of the ice, when the Jets try to gain the offensive zone.
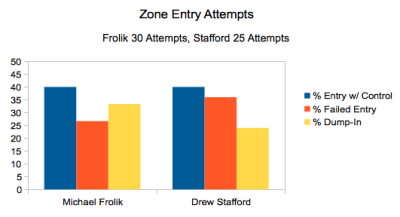
Unlike breakouts, both players are equally efficient in gaining the zone. What separates the two comes with the alternatives. Frolik trades off failed entries for dump-ins. While both are possession losses and sub-optimal, the two differ in the zone the possession is lost. There is more though to simply gaining the offensive zone.

Again, while both players are equally efficient in gaining the offensive zone with control of the puck, the Jets were able to generate more shot attempts per entry with Frolik than Stafford. The question that follows would be: what would one do with this type of information.
Jack Han, analytics coordinator for McGill university, once talked about the four levels of analytics. Level one would simply looking at the qualitative factors with traditional scouting on the two individuals and try to evaluate them and use them from this information.
Level two would be including their impacts on things like shot attempts (also known as Corsi) or our own THP. We would see that Frolik is the stronger play driver and should be valued and used more. Stafford sheltered minutes against weaker lines with heavy offensive zone deployment to make up for his play driving inabilities, thus still using his scoring prowess but minimizing damage from chances against.
Level three would be delving deeper at the micro-statistics and seeing which areas cause their difference in performance. We can use this information by placing Stafford with players where their strengths make up for the Staffords weaknesses and vice versa. One option on the Jets would be Alexander Burmistrov, a player who struggles to score at the rates Stafford does but excels at driving the play.
Level four goes the distance though with organizational development. General managers and scouts use this type of data in addition to traditional scouting when looking at which players to pursue. Coaches use it in developing tactics and drills in practice to teach. With the help of on-ice and video coaching, we would then help Stafford improve these areas of weakness, making him the best possible player he can be.
Numbers are not everything, but they tell a part of the story which a wise person or team may use to make better decisions and give themselves a competitive advantage over their opposition.
Written by Garret Hohl
